Attendance Progress Report
Chesterton Community Sports College: prepared using data from the DfE Monitor Your School Attendance summary reports, autumn term 2024-25 through spring term 2025-26 (Years 7-11).
Summary
Attendance at CCSC has shown sustained, genuine improvement over the past academic year. The school has moved from trailing the national average to consistently outperforming it, and the gap on persistent absence has narrowed considerably. The headline figures and trends below set out the evidence.
Key Achievements
- From below to above the national average: Overall attendance rose from 92.2% (below the national average) in November 2024 to 92.7% now 0.6 percentage points above the national average by December 2025, and has stayed above the national average since.
- Persistent absence gap narrowing: The gap between CCSC's persistent absence rate and the national average narrowed from +5.2 percentage points in November 2024 to +1.4 percentage points in December 2025, the smallest gap recorded across all reports to date.
- Consistent weekly performance: Weekly attendance in autumn term 2025-26 beat the national average in every week recorded, and the same pattern continued through most of spring term 2026, evidencing a consistent trend rather than a one-off improvement.
- Year-on-year growth: Comparing the same point in the year, full autumn term attendance rose from 91.8% (December 2024) to 92.7% (December 2025) a 0.9 percentage point year-on-year improvement.
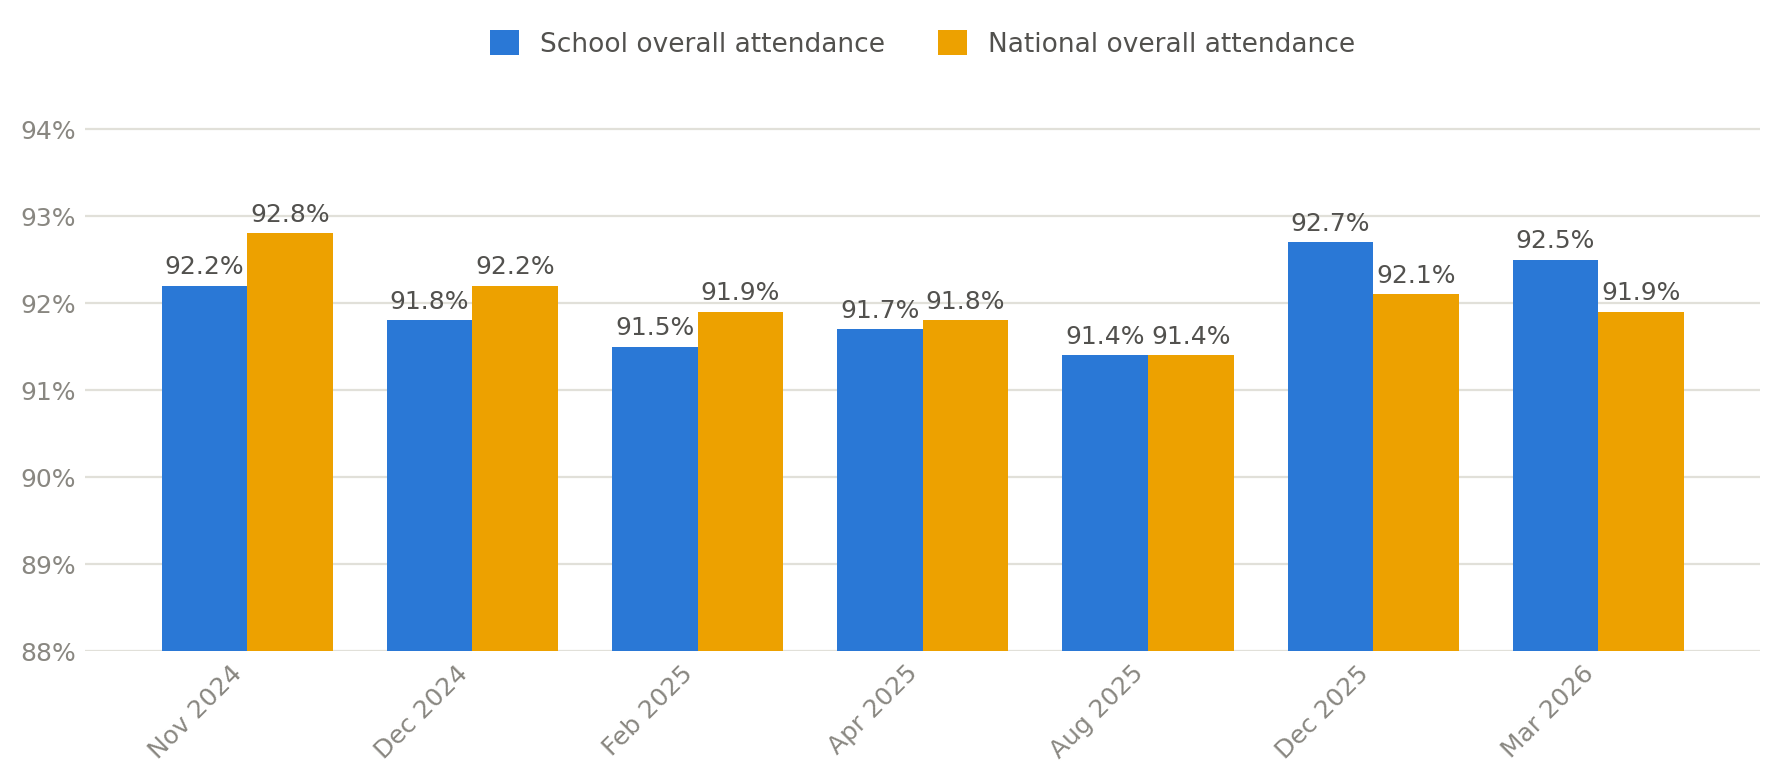
Overall Attendance & Persistent Absence by Term
Figures are for pupils in Years 7–11, compared to the national average for mainstream secondary schools.
| Report period | Overall attendance | Vs national average | Persistent absence gap |
|---|---|---|---|
| Autumn (to 4 Nov 2024) | 92.2% | 0.6% | +5.2% |
| Autumn full term (to 31 Dec 2024) | 91.8% | 0.4% | +2.7% |
| Spring half (to 18 Feb 2025) | 91.5% | 0.4% | +4.4% |
| Spring full term (to 8 Apr 2025) | 91.7% | 0.1% | +2.4% |
| Summer full term (to 13 Aug 2025) | 91.4% | 0.0% | +2.4% |
| Autumn full term (to 22 Dec 2025) | 92.7% | +0.6% | +1.4% |
| Spring (to 30 Mar 2026) | 92.5% | +0.6% | +2.9% |
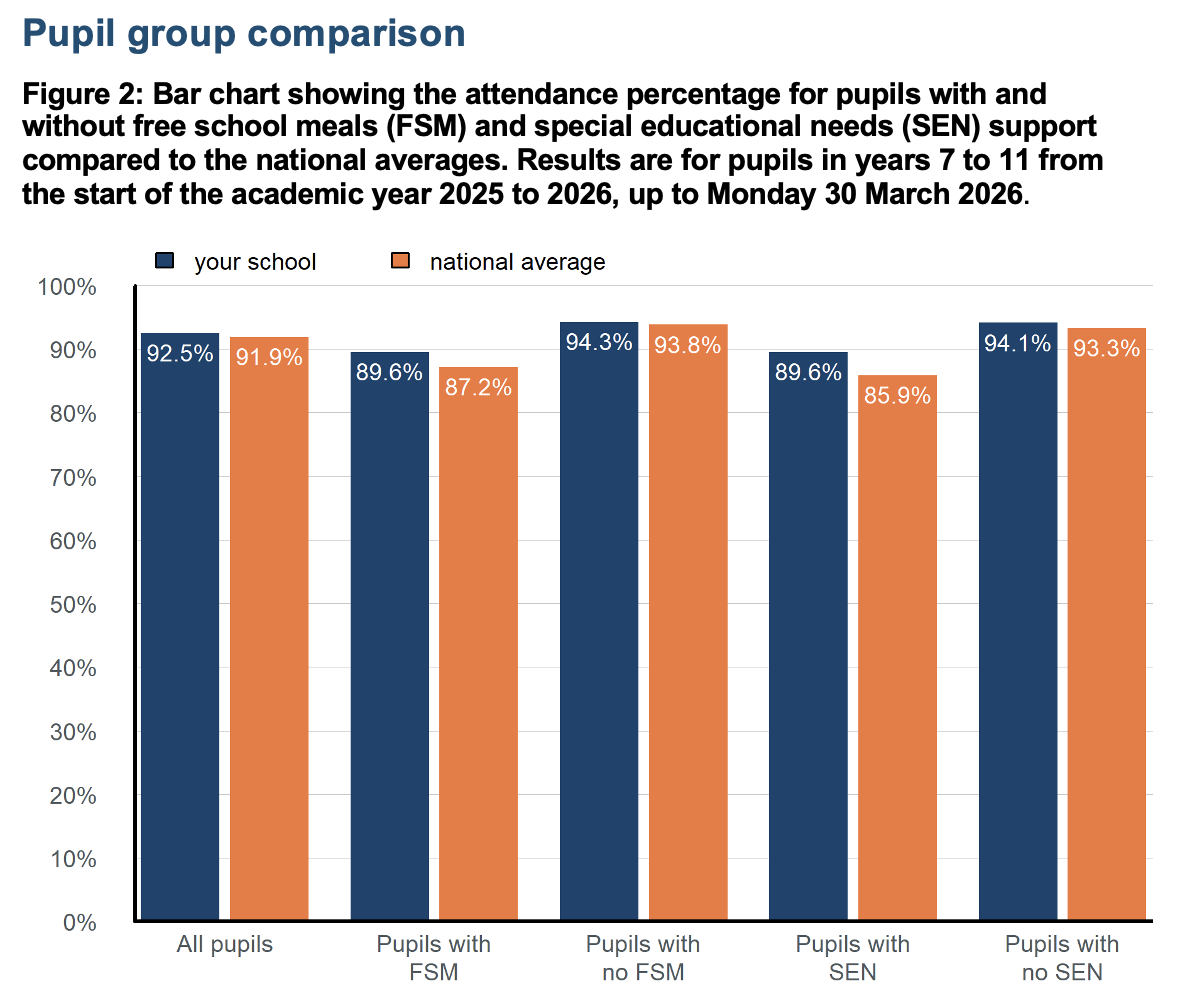
Pupil Group Comparison
Attendance at CCSC among pupil groups, including pupils with SEND and FSM, continues to improve and remains above the national average (see chart below: results are for pupils in Years 7-11 from the start of the academic year 2025-26, up to 30 March 2026).
Looking Ahead
While persistent absence remains an area for continued focus, the consistent upward trend in overall attendance and the narrowing gap on persistent absence reflect the impact of strategies put in place over the past year. The school will continue to monitor weekly data closely and maintain the approaches that have driven this improvement.
CCSC To Be The Best You Can Be